Understanding Demographic Transition in Malaysia
Educational resources on population economics, dependency ratios, urbanization patterns, and labor force dynamics shaping Malaysia’s economic future.
50+
Learning Resources
8
Core Topics
100%
Free Access

Why Demographic Transition Matters
Population structure directly shapes economic policy, labor markets, and social development.
Malaysia’s Changing Population
Malaysia’s demographic profile has transformed dramatically since independence. The country’s working-age population has expanded, urban centers have grown from 26% in 1970 to over 82% today, and dependency ratios tell a crucial story about economic capacity.
Understanding these patterns isn’t just academic. Policymakers use dependency ratio calculations to forecast pension obligations, workforce availability, and consumer demand. Economists analyze population pyramids to predict labor market shifts. Businesses study urbanization trends to understand market expansion opportunities.
We’ve compiled these resources because demographic data drives real decisions. Whether you’re a student, researcher, or policy professional, you’ll find structured explanations of how to calculate, interpret, and apply demographic concepts to economic analysis.

Understanding Demographic Transition in Malaysia
Core Learning Resources
Start with these three essential guides to demographic analysis.
Reading Population Pyramids: What the Shape Actually Tells You
Learn how population pyramids reveal economic stage, fertility rates, and labor force composition. Malaysia’s pyramid has changed dramatically since 1980.
Read Guide
Calculating Dependency Ratios: Step-by-Step Methodology
Dependency ratio measures working-age population against dependents. We break down the formula, explain why it matters for policy, and show real Malaysia examples.
Read Guide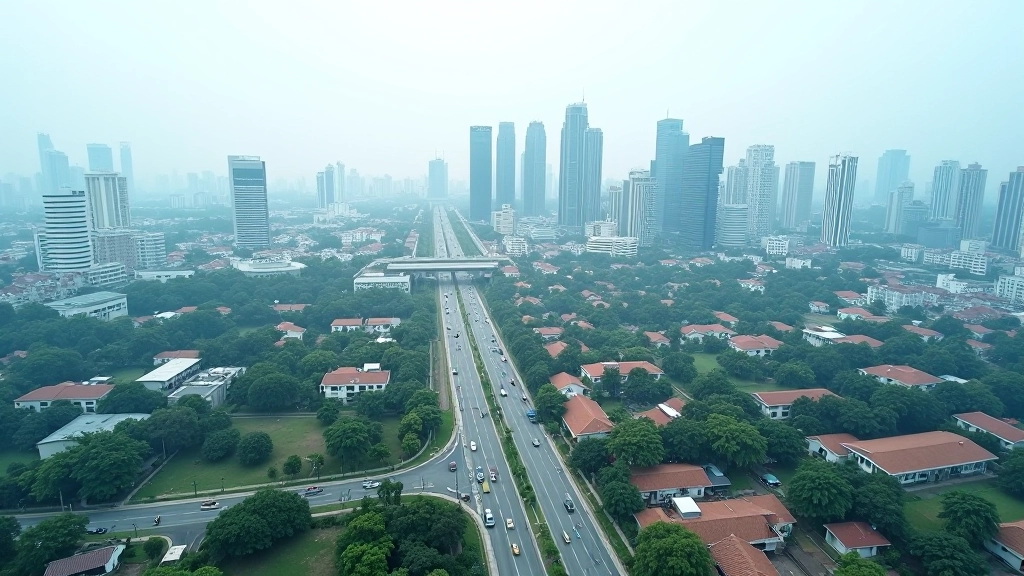
Urbanization’s Economic Impact: Migration, Labor Markets & Growth
Malaysia’s urban population jumped from 26% in 1970 to over 82% today. We examine how migration reshapes wages, productivity, and regional economic development.
Read GuideEight Essential Topics
Each topic builds your understanding of demographic economics and population trends.
Population Pyramids
How to read, interpret, and extract economic meaning from age-sex distribution charts.
Dependency Ratios
Calculate youth and elderly dependency ratios. Understand policy implications for pension and education systems.
Urbanization Patterns
Rural-to-urban migration, urban sprawl, and how city growth reshapes labor markets and regional economies.
Labor Force Participation
Forecast workforce composition, participation rates, and employment trends based on demographic structure.
Education & Skills
How demographic transitions affect demand for education, skill development, and human capital investment.
Health & Mortality
Mortality rates, life expectancy trends, and their role in shaping population age structure.
Housing Demand
How population growth, household formation, and urbanization drive real estate and construction sectors.
Economic Growth
The demographic dividend, productivity, savings rates, and how population structure affects GDP growth.
How to Use These Resources
A straightforward path from beginner to confident analyst.
01
Read the Fundamentals
Start with population pyramids and dependency ratios. These two concepts unlock understanding of how economists read demographic data. You’ll learn what age distribution actually means and why it matters for policy decisions.
02
Explore Malaysia’s Data
Every guide includes real examples from Malaysia’s demographic history. See how population pyramids changed between 1970 and 2020. Study actual dependency ratio calculations. Examine urbanization statistics that shaped economic policy.
03
Apply to Analysis
Learn how demographic insights connect to labor markets, education policy, pension planning, and economic growth forecasting. We show you exactly how economists and policymakers use these concepts in real decision-making.
04
Dig Deeper
Each topic has follow-up resources, data sources, and methodological details. Whether you’re writing a thesis, building a model, or informing policy, you’ll find the depth you need to support your work.
Common Questions
Answers to questions we hear frequently from students, researchers, and professionals.
What’s the difference between population pyramid shapes?
Pyramid shape tells you about fertility rates and mortality patterns. A wide base means high birth rates. A narrow top means high mortality. Malaysia’s pyramid shows a contracting base — fertility has declined significantly, which changes the entire economic outlook.
Why do economists care about dependency ratios?
Dependency ratios measure economic burden. A ratio of 0.5 means one dependent for every two working-age people. This affects tax revenue needed for pensions, schools, and healthcare. It’s a quick indicator of whether a country can sustain its social programs.
How does urbanization affect labor markets?
Cities concentrate jobs, capital, and skills. But rapid urbanization can create housing shortages and wage pressure. We examine both opportunities (higher productivity, better jobs) and challenges (congestion, inequality) that come with urban growth.
What’s the demographic dividend and when does it end?
When working-age population grows faster than dependents, you get a demographic dividend — more workers per dependent, more savings, more economic growth potential. Malaysia experienced this from 1980s-2010s. But it doesn’t last. We show you how to recognize when it’s ending and what comes next.
Can I use this for academic work or policy analysis?
Absolutely. These resources are designed for students, researchers, and policy professionals. All explanations include methodological foundations and cite major sources. You’ll find the rigor you need for thesis work or policy briefs.
Are the Malaysia examples current?
We update data regularly using official sources from Department of Statistics Malaysia, World Bank, and UN demographic databases. Each guide shows data publication dates so you know exactly how recent the numbers are.
Malaysia’s Demographic Story in Numbers
Key changes that shaped the economy and society.
1970
26% Urban Population
Malaysia was still predominantly rural, with agriculture dominating employment.
1980
4.2% Annual Growth Rate
Peak population growth during the demographic dividend era, fueling rapid economic expansion.
2000
62% Urban Population
Major shift toward cities. Manufacturing and services became dominant economic sectors.
2024
82% Urban Population
Malaysia is now primarily urban. Labor force participation and skill requirements have transformed entirely.
Ready to Deepen Your Understanding?
Whether you’re studying demographic economics for the first time or applying it to professional work, we’re here to help. Ask questions, request specific topics, or discuss how these concepts apply to your research or policy work.
Contact Us